How to benchmark your C# code
on
For a little fun I recently completed the string calculator TDD Kata. In my implementation there are a few areas that make use of StartsWith, IndexOf and SubString methods. Code such as this will more often than not open up the debate of the aforementioned string methods vs. regular expressions. For my own entertainment I wrote two implementations of the string manipulation area of the Kata, one using SubString and the other using RegEx. This lead to a question - which is faster and in what context? I would typically create a throw away console app and make creative use of the StopWatch class then paste in the blocks of code to compare execution times but I decided this time I would create something a little more re-usable and share the results.
A simple app for performance tuning your C# code
I wanted a very simple method of comparing the two implementations so I could prove which would be the fastest. Since I was writing a lot of unit tests whilst performing the string calculator I wanted something that worked in a similar fashion to benchmark and compare my code. I had the idea of creating a small unit of code and being able to tag the method with an attribute. I would then need some way of being able to run a bunch of these small units of code and have some output reporting the execution time of each unit.
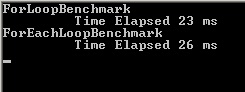
The below class illustrates the usage. Note the ProfileClass and ProfileMethod attributes. In this example I’m comparing a For loop with a ForEach loop.
[ProfileClass]
public class ForEachLoopBenchmarks
{
    [ProfileMethod]
    public void ForLoopBenchmark()
    {
        List<int> list = GetNumberList();

        for (int i = 0; i < list.Count; i++)
        {
        }
    }

    [ProfileMethod]
    public void ForEachLoopBenchmark()
    {
        List<int> list = GetNumberList();

        foreach (int i in list)
        {
        }
    }

    private List<int> GetNumberList()
    {
        List<int> list = new List<int>();
        for (int i = 0; i < 1000; i++)
        {
            list.Add(i);
        }
        return list;
    }
}
The output from the above class looks as follows:
In the context of the string calculator the code I put together to compare the two string parser implementations looks as below. By the way, the substring implementation was faster, which is what I expected in this context of a short and simple string.
[ProfileClass]
public class ParserBenchMarks
{
    [ProfileMethod]
    public void SubStringParser()
    {
        IDelimiterParser parser = new SubStringDelimiterParser();
        parser.Parse("//[*]\n1*2*3*7*5*19*1*12");
    }

    [ProfileMethod]
    public void RegExParser()
    {
        IDelimiterParser parser = new RegExDelimiterParser();
        parser.Parse("//[*]\n1*2*3*7*5*19*1*12");
    }
}
I created a class library using the naming convention .benchmarks in my solution that contains these classes.

###How to use?
Just simply add a reference of the pUnit.dll to your .benchmarks project and add the attributes to your class and method(s) as per the previous examples. This is available as a Nuget package.
###Running the bench marks
To run the bench marks and get the results you need to create a new console application, add a reference to the pUnit.dll and add a reference to the project or assembly that you wish to benchmark. Paste the below code into the Main method of the Program class and when the code runs it will scan the assemblies, execute the methods to profile and output the results.
class Program
{
    static void Main(string[] args)
    {
        ProfileRunner rp = new ProfileRunner();
        rp.Run();
    }
}
Ideally I would like to create a right-click menu item that works in a similar fashion to TestDriven.Net, however I will follow that up in a later revision of the code.
###How to benchmark
The main method that performs the benchmark was based on this question & answer from StackOverflow. The simplicity of this approach was a perfect match for what I was trying to achieve. If you would like more background about this method I recommend reading the answers to the question.
public void Profile(string description, int iterations, Action func)
{
    // clean up
    _garbageCollector.Collect();
    _garbageCollector.WaitForPendingFinalizers();
    _garbageCollector.Collect();

    // warm up
    func();

    IStopWatch watch = _stopWatch.StartNew();

    for (int i = 0; i < iterations; i++)
    {
        func();
    }

    watch.Stop();
    WriteToConsole(description);
    WriteToConsole(string.Format("\t Time Elapsed {0} ms", watch.ElapsedMilliseconds));
}
The default number of iterations in this application is 1000, however you can overload this number per method by passing the value via the attribute constructor.
[ProfileMethod(100000)]
public void SubStringParser()
{
    IDelimiterParser parser = new SubStringDelimiterParser();
    parser.Parse("//[*]\n1*2*3*7*5*19*1*12");
}
I have called this little framework pUnit - where the p stands for performance!
Source Code
You can download the full source for pUnit.
###Download from Nuget
PM> Install-Package pUnit
See the Nuget project page for pUnit.