Performance Testing an ASP.Net Application: 10 Years of .Net Compressed into Weeks #3
on
This post is part of a blog series ASP.Net 10 Years On. Even though this is part of a series I have tried to make each post standalone.
In the last post we reviewed the code of the project. We concluded that we don't want to keep the code but before we trash it, it would be useful to run some performance tests to give us a base line to build upon. We should be aiming to exceed this performance and at an absolute minimum should not drop below it.
Being as we are using an Access database for the backend I'm not expecting big things performance wise. It would be interesting to put a number on this. It's not impossible that we could salvage most of the code and replace the database calls to access a SQL Server instance. We will do this also and treat the second set of performance statistics as the line in the sand we do not want to cross.
How to Create a Web Performance Test
Using Visual Studio Ultimate create a new Test Project. Add a new item and select: Web Performance Test...
You will then see a window that looks as below. You can enter the URL of the page to be tested.
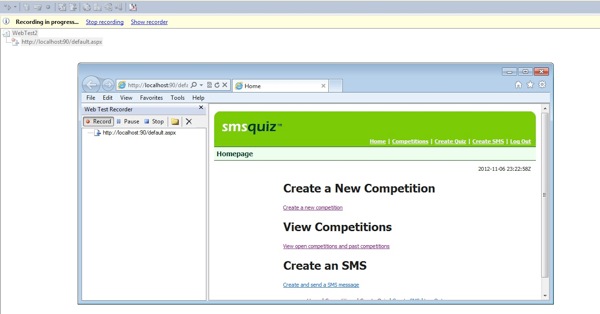
Once the page has loaded, select stop recording. We will now have a test that we can re-run that will load this page and verify the page loads in the same state as our recording. If it does not, the test fails like a conventional unit test.

Next we add another test and select Load Test…. A wizard allows us to select the Web Performance Test we wish to load repeatedly. There are options that allow us to specify the user load, length of test, network constrains and so on. Visual Studio Ultimate makes it remarkably easy to create load tests.
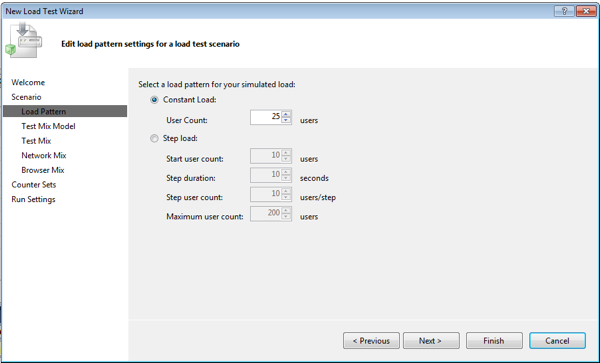
We simply run this load test and Visual Studio will display statistics regarding the test run.
Using this process I created Web Performance and Load tests for the key areas of the application. Each test will run for 5 minutes under a constant load of 10 users. Each section is detailed below.
It is possible to report on a wide range of stats such as CPU usage, memory usage etc. To keep the results of these tests simple we're going to filter the results to display the following:
- Pages served per second
- Average page response time
Performance Testing the Competition Entry API
The code that is likely to be under the most load is the API that accepts the incoming SMS messages. It simply accepts an HTTP Form Post and saves the values to the database.
The code under test:
Testing the MS Access Database
It's pretty clear we need to get rid of this database, but before we do it will be interesting to track the current performance so that we can note the gains when moving to a higher powered database. We can also re-use the same load test(s) at a later stage.
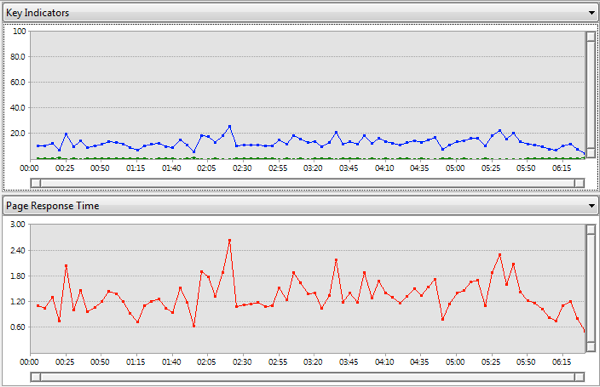
Stats from a load test using access database.
The blue line indicates the avg. response time, the green line indicates pages/sec. The red line indicates the avg. page response time.
Erratic lines are never a good indication and the green line that indicates the number of pages served per second is a flat line across the bottom. Our code seems to have flatlined!
Overall Results
Max User Load 10
Pages/Sec 7.99
Avg. Page Time (sec) 1.24
7.99 pages per second is not an earth shattering number. This test was run on my high spec laptop so it may be faster on a server. That equates to roughly 580 requests a minute which for very low traffic applications may just about survive. However with SQL Express freely available it makes no sense to keep this implementation.
Testing the SQL Server Express Database
Running the exact same test but changing the code slightly to make use of SqlClient rather than OleDb the numbers now look as follows:
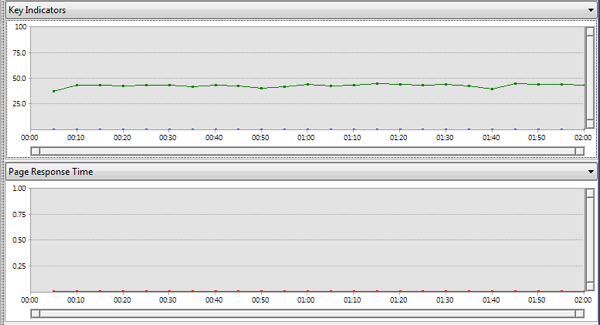
Stats from a load test using SQL Server Express
The blue line indicates the avg. response time, the green line indicates pages/sec. The red line indicates the avg. page response time.
By contrast to the previous graph this is a sign of a healthier application. The blue line for avg. response time is consistently low. The green line for pages/sec is much higher than before and the line is stable. Also the red line for response time is consistently low. This indicates stability - which is what we are seeking!
Overall Results
Max User Load 10
Pages/Sec 478
Avg. Page Time (sec) 0.0093
This is a little better! 478 vs. 7.99 responses per second is a 5882% increase. These numbers indicate we can perform roughly 28680 transactions per minute. This is more than enough to satisfy the demands of our client. Also consider that these tests were run within a virtual machine with 2GB of RAM - we could expect better numbers on a higher spec server or cloud computing provider.
The Competition Details Page
In the code review, we identified some major problems with the competition details/dashboard page. There were excessive and duplicate calls to the database - a database which we already know has never been intended for websites. We know it's going to be bad - but let's put a number on how bad!
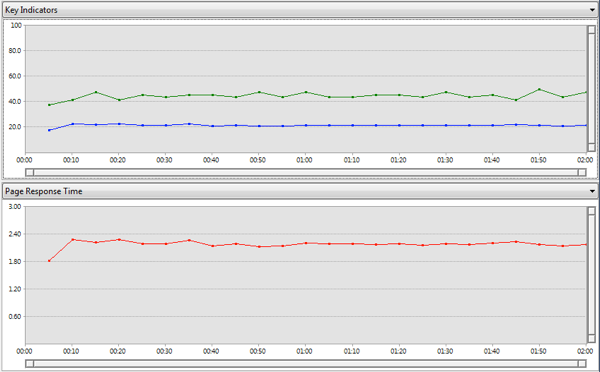
Stats from a load test using the access database.
The blue line indicates the avg. response time, the green line indicates pages/sec. The red line indicates the avg. page response time.
It's an interesting result. The line is pretty stable, but in this instance it's not for a good reason. The page is so slow and has so many database connections that it's preventing the requests served and response times from becoming erratic by making everything stable, but very slow.
Overall Results
Max User Load 10
Pages/Sec 4.77
Avg. Page Time (sec) 2.37
A meagre (just under) 5 page requests per second is all that this page can manage with an average load time of 2.5 seconds.
Tools for Load Testing
I've upgraded from Notepad and these days I'm using Visual Studio Ultimate Edition which comes with a bunch of handy test features for performing web tests and load tests. If you don't have VS Ultimate here are some free tools I've used in the past:
WCAT is a free tool from Microsoft, there is a slight learning curve to getting this up and running. There is no GUI which makes it nice and lightweight.
JMeter is an open source load tester written in Java.
If you have VS Ultimate and want to learn more about the testing tools check out this video from Pluralsight titled Web Application Performance and Scalability Testing.
In the next post we will review what tools and methodologies we plan to use to re-develop this application. See the RSS subscription links at the bottom of the page to follow this series.

